Video Gamma
Video gamma describes power-law relationships used to encode or display image brightness.
Both curves below reach the same black and white. Their difference is in the tones between those endpoints:
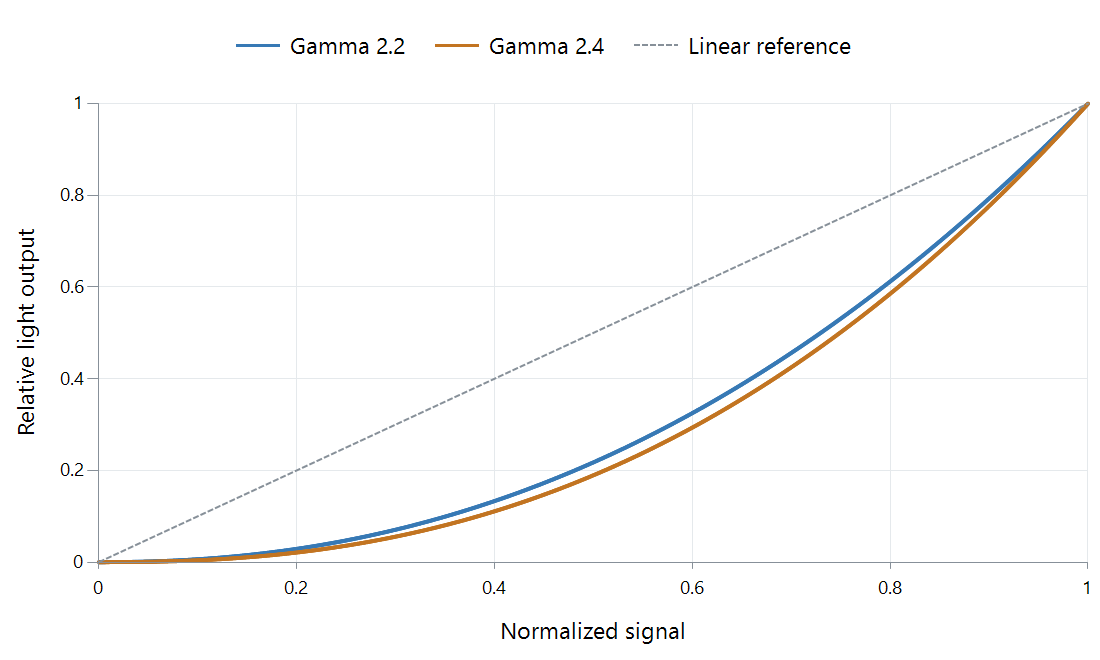
Zero-black display models with white normalized to one. The dotted diagonal is a linear reference.
Gamma is the exponent in a power relationship. For a display model written as L = V^gamma, a higher exponent gives less light at intermediate normalized signal values.
At V = 0.5, gamma 2.2 gives about 0.218 of white, while gamma 2.4 gives about 0.189. With a hypothetical 100-nit white, that is 21.8 versus 18.9 nits. The darker middle tone does not require a change in peak white.
State the direction of the relationship
| Use of a gamma number | What the exponent acts on |
|---|---|
| Capture or encoding shorthand | Light values becoming a nonlinear signal |
| Display response | Signal values becoming light |
| Image adjustment | An existing image representation changed by another power |
For values between zero and one, a power below one raises the number; a power above one lowers it. That mathematical direction is why “increase gamma” can mean different visual changes in controls that apply different conventions.
Real transfer functions can use more than a power. The BT.709 OETF has a straight segment near black; BT.1886 includes display black and white; PQ uses a different nonlinear function.
When comparing an Emby picture across playback paths, keep the output and display modes consistent. Then distinguish a deliberate tone adjustment from the transfer relationship the signal expects. The graph gives a concrete check: a pure power adjustment chiefly redistributes intermediate tones, while a range error can move the black and white endpoints too.