Tone Mapping Curve: Reinhard
Reinhard is a tone mapping curve that compresses increasingly bright values into a limited output range.
Start with the simple relationship T(x) = x/(1+x) for an already scaled linear-light input. At small x, the denominator is near one. As x grows, the denominator grows too, making further input increases contribute less output.
| Input x | Basic output | Output after normalization to peak 8 |
|---|---|---|
| 0.1 | 0.0909 | 0.1023 |
| 1 | 0.5000 | 0.5625 |
| 4 | 0.8000 | 0.9000 |
| 8 | 0.8889 | 1.0000 |
The basic function approaches one gradually. At a finite source peak of eight, its endpoint is eight-ninths. Multiplying by nine-eighths makes that known peak reach one and also raises the other mapped values.
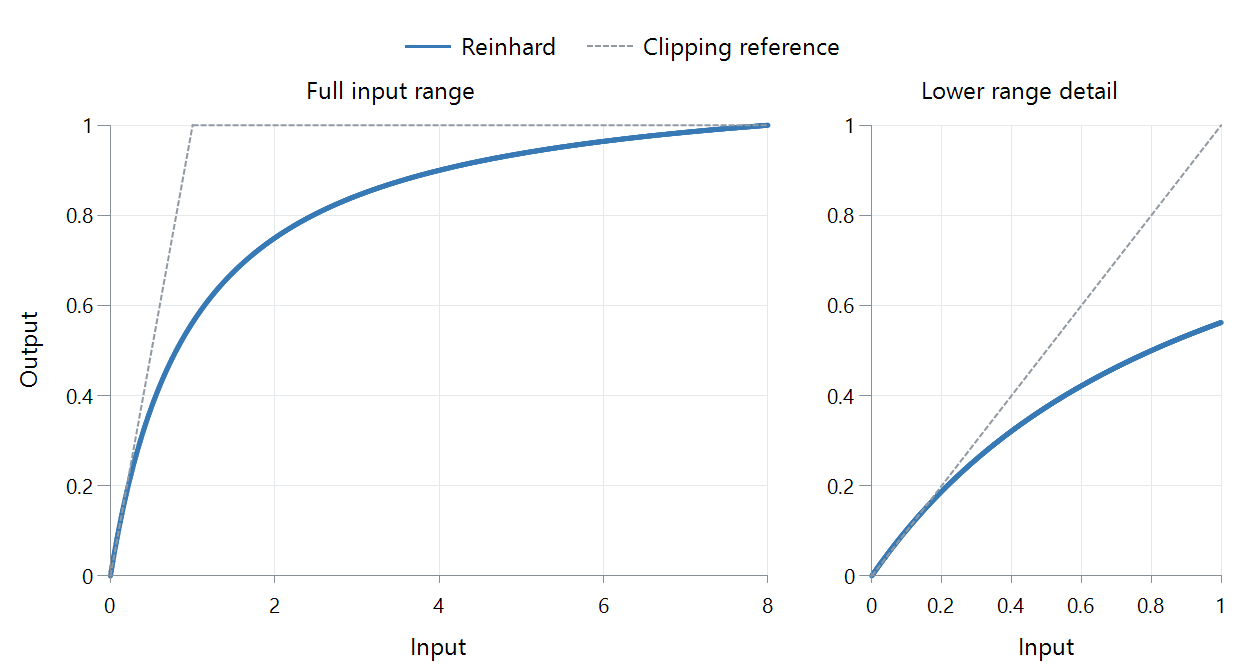
FFmpeg 8.1, public parameter 0.5, source peak 8, output white 1, relative linear light for neutral gray. Dashed gray shows clipping.
Highlight compression and lower-tone brightness
Inputs 4 and 8 are four units apart, but the normalized outputs differ by only 0.1. The values remain ordered and distinct; much less output contrast separates them. An input of one moves to 0.5625, showing that this mapping also changes ordinary levels.
Uniform division by eight would put the same input of one at 0.125. The nonlinear relationship spends more of the output on the lower region and compresses the top more strongly. That is the actual compromise visible in the plot.
Distinguish the curve from the complete photographic operator
Reinhard and coauthors' original photographic tone-reproduction work also includes exposure scaling and a spatially varying method. A global function called Reinhard in a video filter represents one part of that family, with its own parameter and peak convention.
FFmpeg's stated parameter corresponds to the normalized function in the table. In general its scalar form is x/(x+k) × (P+k)/P, with k derived from the public parameter. Changing k or P changes the mapping even before surrounding color operations.
When comparing an Emby conversion, identify the actual curve implementation and normalization, then inspect both ordinary objects and highlight texture. The arithmetic here explains their relative placement rather than assuming the historical photographic method and a video option produce identical pictures.