What is a graph?
In media software, a graph is a set of nodes and the edges that connect them, not a chart. What nodes and edges stand for depends on the application.
The word graph has two common meanings that are easy to confuse:
- In everyday language and school mathematics, a graph is a chart: a plot that shows how values relate, such as bitrate over time or the curve of a function. Most pictures labelled "graph" show this kind.
- In computer science and discrete mathematics, a graph is a structure of connected elements. This is the meaning behind terms such as filter graph and the one used throughout this documentation.
The two have little in common beyond the name. A chart places values on axes. A graph in the second sense has no axes, and the position of its elements on a drawing carries no meaning.
Definition
A graph consists of a set of nodes (also called vertices) and a set of edges, where each edge connects two nodes. That is all the definition requires: a graph records which elements are connected, not where they are or what they look like.
In a directed graph, each edge leads from one node to another. Drawings show the direction with arrows. Graphs in media software are usually directed, because data or decisions proceed from one element to the next.
Boxes and arrows are a common way to draw a graph, but the drawing is only one presentation of it. Software holds graphs as data, and an FFmpeg filtergraph, for example, is written as a single line of text.
The definition does not say what nodes and edges stand for; each application decides that. Reading any graph therefore starts with two questions: what does a node represent, and what does an edge mean?
Processing graphs: edges carry media
In a media processing graph, nodes are operations, and each edge carries the output of one operation to the input of another.
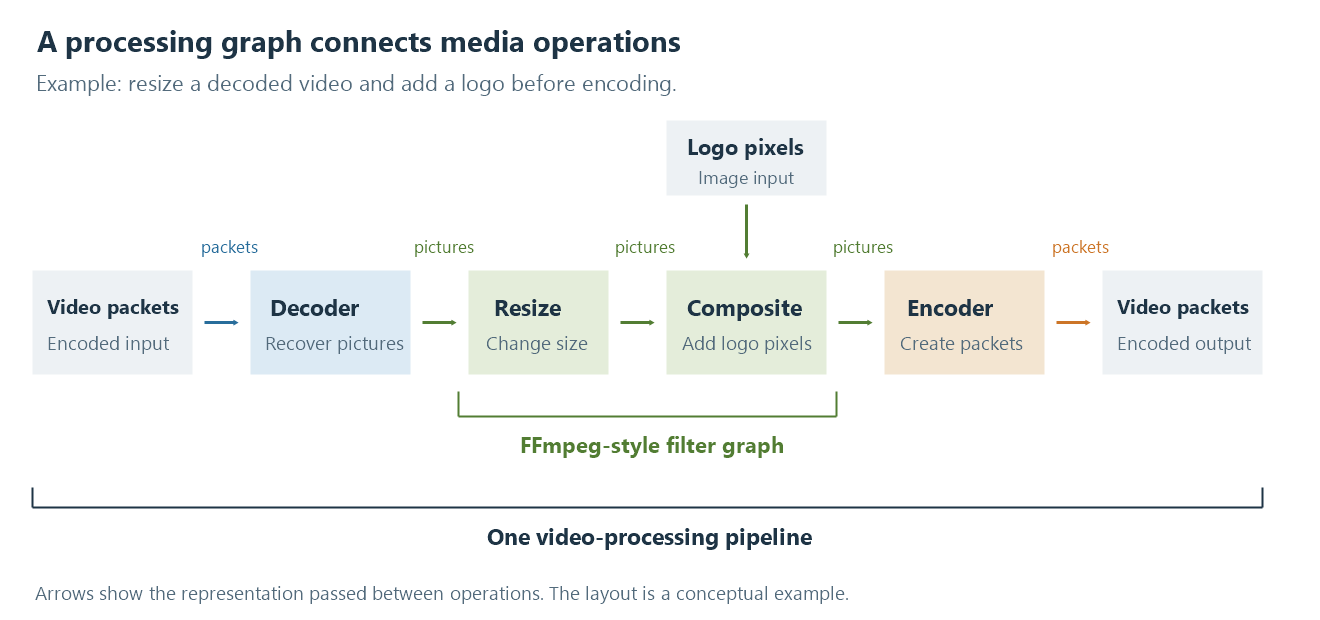
A conceptual video processing path. The arrows between operations show data dependencies, not how long each operation takes.
A decoder turns encoded packets into pictures. A scaler resizes them, and a compositor places a logo on each picture. The logo arrives through a second edge from its own source. An encoder turns the result back into an encoded stream.
Three shapes recur in such graphs. A chain connects operations one after another, like the decoder, scaler and encoder. A join combines several inputs into one result, like the compositor. A split sends one output to several destinations, for example to produce a full-size picture and a thumbnail from the same decoded frame.
Edges also determine what kind of data travels between operations: packets before the decoder and after the encoder, pictures in between. An output can only be connected to an input that accepts its data. For this reason, nodes have defined inputs and outputs, called pins in DirectShow and pads in GStreamer.
Where a graph begins and ends depends on the software. An FFmpeg filtergraph works on decoded pictures or audio samples, so in the illustration only the scaler and the compositor belong to it. A DirectShow filter graph also includes sources, decoders and renderers. The filter graph article explains how order, formats and branching affect the result, and the transcoding pipeline shows what surrounds the filtergraph.
Decision graphs: edges connect choices
Emby Server's Expert Mode uses a graph for a different purpose: choosing which transcoding configuration handles an operation. Its nodes do not process media. A GPU node, for example, stands for a device used with a particular configuration, so the same physical GPU can appear as several nodes.
The edges change meaning accordingly. They describe how choices are considered, not how media moves. Several GPU nodes in the graph are alternatives for an attempt, not a picture passing through several GPUs in turn.
Drawn on screen, a processing graph and a decision graph can look alike. The difference lies only in what their nodes and edges stand for.
See Also
- Media filter graphs
- How a transcoding pipeline works
- How media APIs connect applications to hardware