All Activity
- Past hour
-
 Blopezedits joined the community
 -
Basyouny joined the community
-
 Charly123 joined the community
 -
 andresforero joined the community
 -
 rafaelmosquera joined the community
 -
 vasum joined the community
 -
 XanderJFO18 joined the community
 -
@ebrCould it be possible to make this available in the Android Tv app. Currently can set playback to 1000 Mbps Would be good to have it the same as the others: Up to 4k - 200Mpbs Up to 1080p - 60 Mbps This should then allow people to set to max 1080 and then it will play the 1080 version if both exist Thanks
-
 Stegss joined the community
 -

TV Show Status — TMDB-powered Returning/Ended/Cancelled badges for series
Blueskies278 replied to Blueskies278's topic in Plugins
Thanks for reporting -
Hi, not yet. It’s on the to do list. Thanks
-
TV Show Status — TMDB-powered Returning/Ended/Cancelled badges for series
Blueskies278 replied to Blueskies278's topic in Plugins
Thanks for reporing -
I find it simply annoying AF.
- Today
-
wow. the connecting to server is longer after the update
-

Setting to revert latest mixed content view?
Wyatt239 replied to Halliphax's topic in General/Windows
@LukeHow about now? - Yesterday
-
No idea what went wrong but something prevented it from being downloaded. I've reuploaded it to the catalog as version v5.7.3.0 and it seems to work now. Sorry about it all! This last version has been a bit of a sh*tshow and i hate to have to make people reboot their servers multiple times!
-
I do not plan on upgrading MB or CPU anytime soon. The gpu you suggested above would probably be something I will look at. I still have room for 2 more drives in current setup. My server is really just for Emby. I would like to set up automation for torrents however, I do not have the time or knowledge for a arr stack yet.
-

Stumped trying to get an API key to work with Powershell for Movies reporting
js28194 replied to FatherSaint's topic in General/Windows
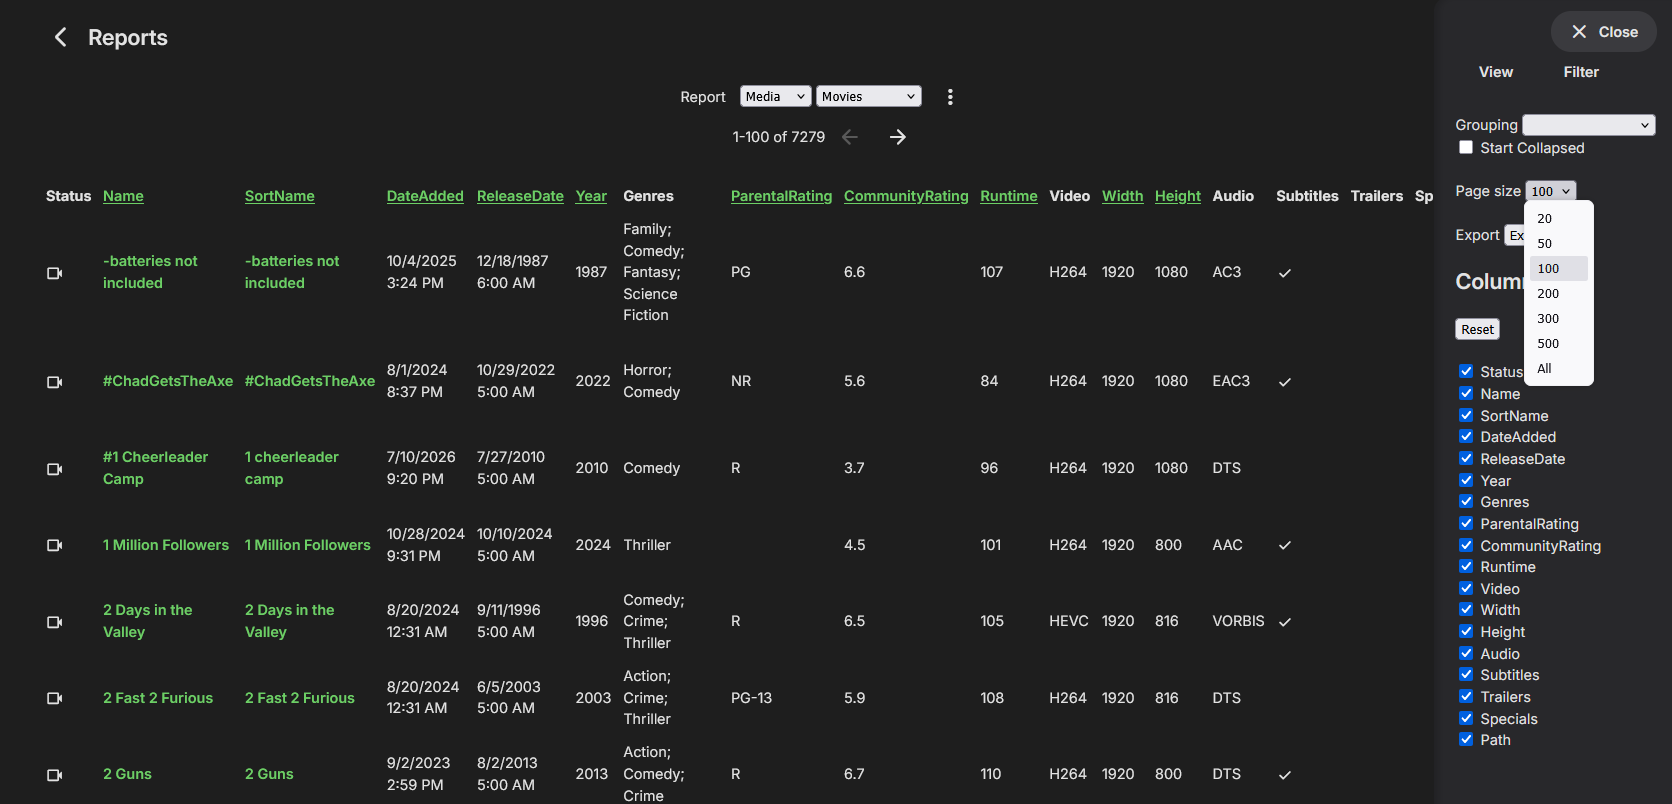
There is a reports plugin that compiles this data for all your movies already. I have found that you can change the default from 100 to all then export to excel and do some excel ju-jitsu. By that I mean using the data filter tool in excel. All that takes 5 minutes vs. trying to develop a script that takes hours or days. Fun if your just trying to learn, but re-inventing the wheel seems a bit much. Just sayin.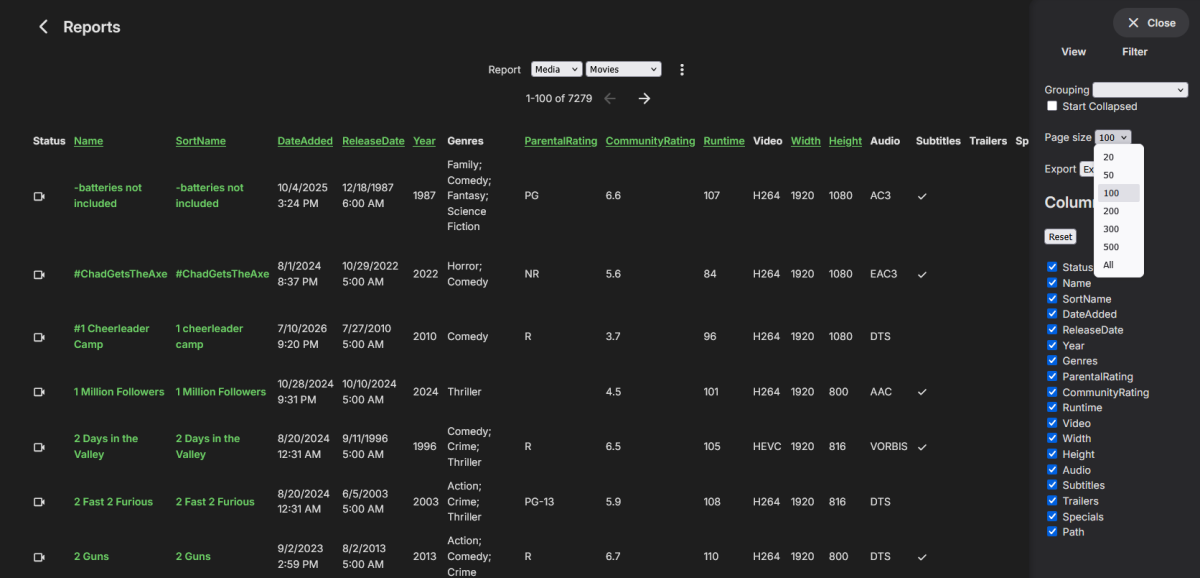
-
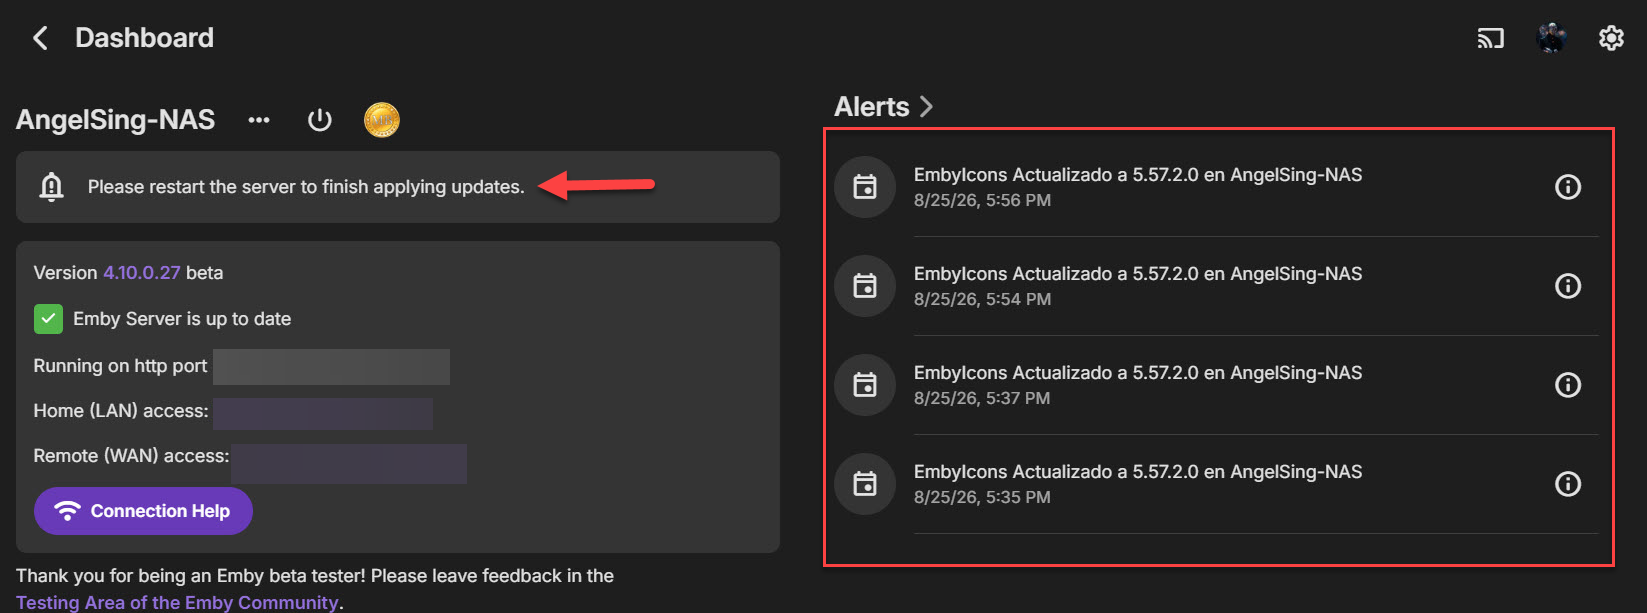
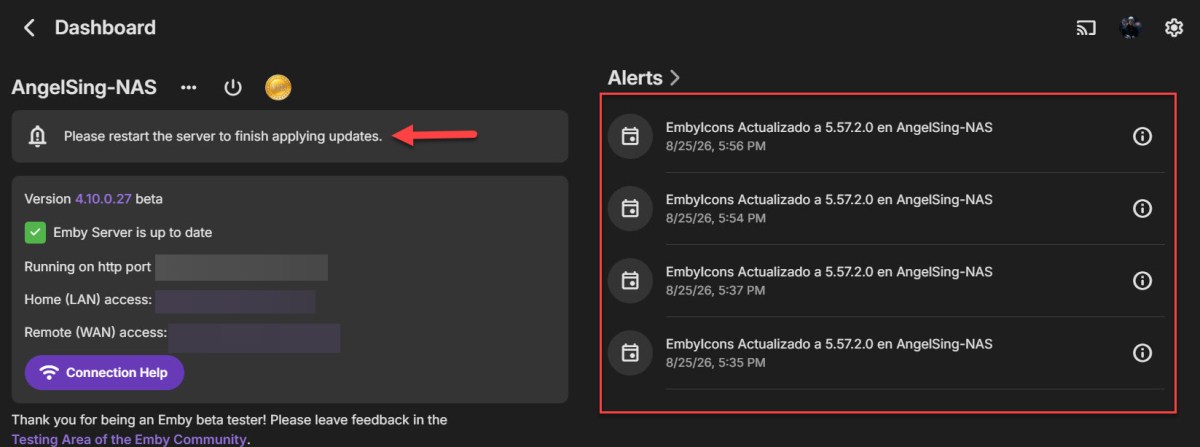
@yockerHi! Hope you're doing well. I wanted to check in and see if you might know what’s going on with your plugin. For a little while now, I’ve been constantly getting notifications saying a new version of EmbyIcons was installed and that Emby needs to restart. I’ve restarted Emby several times and even rebooted the entire NAS, but the notification keeps popping up. Any idea what might be causing this or how to fix it?
-
Any update on this? I am not able to sideload on my GM so I don’t think I have a workaround either
-
I have a powerful machine and disk, but more importantly, the language chosen in both of those checkboxes says nothing to the sort of what you just said, and both as written is unqualified and as you have written is unqualified. I suspect a top of the line intel i9 is better than "some systems" .... I'd argue, it is better than MOST systems. An RTX5080 is better than most GPUs..... a 500TB+ disk setup with all high end (albiet 7200RPM) disks, is better than avg.... unless someone is using SSD...... is still better than avg..... Again, all language that is unqualified, and again, ****** WITH THE CHECKBOX CHECKED, implies "it might crash ****** not....... that with the checkbox unchecked, it WILL CRASH. Respectuflly, does this explain why I am painting the f*****ed eitherway, and neither toggle is definitive?
-

Moonfin, a new cross platform client
MediaEmby1968 replied to bingbong69_'s topic in Third Party Apps
This looks interesting, but what I'm not clear on is how to install it on both an Emby and a 2016 Samsung TV. I think it would be good to clarify this on the website. Can someone tell me how to install it on both an Emby and a 2016 smart TV? Do I need a Premiere account to install it? -

Stumped trying to get an API key to work with Powershell for Movies reporting
Lessaj replied to FatherSaint's topic in General/Windows
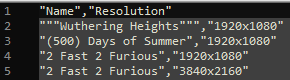
I ran the query against my instance with api_key and it accepted it. I ran the exact script with my own variable too and it worked, I just changed the api_key name I mentioned. You should be able to manually run a curl with the path looking like this: EDIT: Could be HTTP instead as well, I used "https://path.to.my.emby" for the variable, but "http://ip.address:port" should work too.
-
I don’t quite understand this point. Watching a movie won’t delete it from the library, or are you filtering the library by unwatched and it is still showing even though it has been watched? Can explain the steps to reproduce and how you have the library folder view/sorting/filtering configured?
-

Incorrect Artist Identification / Search Results
Rumzzz replied to Rumzzz's topic in General/Windows
It's true this may have been an issue from a previous server version (I've been using Emby for a while). I don't really have a way to test this on a fresh install but even when I manually delete the album containing the "incorrect" artist identification, after a rescan the issue persists. I agree that nailing down the original cause would be hard to do, mostly just throwing this out there. If anything, I am more so interested in how to get Emby to clean up / recognize any incorrect artist identifications -

Stuck at Ready to Transfer (Windows Emby App)
Luke replied to mrtechnologist's topic in Windows & Xbox
Hi, we are looking into this. Thanks. -
Correct. It is server-wide.
-
Going over your first issue again, it's hard to say what might have happened when this content was first imported into your database. Do you have a way of testing this with a fresh install, or with all new content where the tracks, album and artists have never been in your server database before? Otherwise we're kind of guessing about how it got that way, whether be through some defect in an older server version, various tinkering you might have done, etc.
-
Hi. And...
-
Edit: This is the 3rd post explaining how to do and revert the patches. The 2nd post (the one explaining the 2nd fix) got limited or something and is hidden until mods or someone approves it. Emby 4.10.x search-freeze workarounds — how to apply and revert each patch These are the workarounds referenced in my two bug reports (the "recent searches query freezes the server" thread and the "SearchTerm slowness / degenerate planner statistics" thread). They fixed, on our server (~191,000-item library): the whole server freezing for 1–2 minutes whenever someone opened search (100+ s → 16 ms), searches like lord taking a flat ~13 s (→ under 1 s), 1–2-letter searches from TV apps (which search per keystroke) taking 30–50 s and stalling everyone else (→ under 0.3 s). Read before starting At your own risk. These modify the live Emby database (an index and planner statistics) and system.xml. They are workarounds until the Emby team fixes this properly. Make the backups in Step 0 first. Applies to the 4.10.x beta schema (tables MediaItems, UserDatas, AncestorIds2). If those tables don't exist in your library.db, you're on 4.9.x or older — this guide does not apply. Paths below are for the Linux .deb install (/var/lib/emby). Docker: run the commands where the config volume is mounted. Windows: the same SQL applies via any SQLite tool against library.db in your programdata folder. Commands use python3 (preinstalled on most Linux servers) so you don't need the sqlite3 CLI. If you have the CLI, the SQL statements inside work there too. Run as root. "Cookie poke": SQLite only re-plans cached queries when the schema version changes. ANALYZE and statistics edits don't change it, so after Patches 2/4 the running server keeps its old (slow) query plans until you either restart Emby or "poke" the schema version by creating and dropping a dummy index. The poke is included in the commands below. Patch 1 (real DDL) needs no poke. Never edit system.xml while Emby is running — Emby rewrites it from memory on shutdown and your edit is silently lost. Always stop → edit → start. # Patch Fixes Downtime 0 Backups — none 1 Partial index on UserDatas Search page freezing the whole server none 2 Full ANALYZE Flat ~13 s searches (bad statistics) none 3 system.xml settings Flat ~13 s searches (bad statistics) ~1 min restart 4 Statistics override for AncestorIds2 Stops Emby re-creating the bad statistics; bigger DB pool none Step 0 — Backups (do this first) Consistent snapshot of the live database (safe while Emby runs, uses SQLite's VACUUM INTO mkdir -p /root/emby-backups python3 -c " import sqlite3, time con = sqlite3.connect('file:/var/lib/emby/data/library.db?mode=ro', uri=True, timeout=60) dest = '/root/emby-backups/library-backup-' + time.strftime('%Y%m%d') + '.db' con.execute(\"VACUUM INTO '\" + dest + \"'\") con.close(); print('backup written:', dest)" Copy of the config file: cp /var/lib/emby/config/system.xml /root/emby-backups/system.xml.bak-$(date +%Y%m%d) Snapshot of the current planner statistics (lets you revert Patch 2/4 exactly): python3 -c " import sqlite3, time con = sqlite3.connect('file:/var/lib/emby/data/library.db?mode=ro', uri=True) rows = con.execute('SELECT tbl, idx, stat FROM sqlite_stat1').fetchall() dest = '/root/emby-backups/sqlite_stat1-backup-' + time.strftime('%Y%m%d') + '.sql' with open(dest,'w') as f: f.write('DELETE FROM sqlite_stat1;\n') for t,i,s in rows: f.write(f'INSERT INTO sqlite_stat1(tbl,idx,stat) VALUES({t!r},{i!r},{s!r});\n') print('stats snapshot written:', dest)" Patch 1 — Partial index for the "recent searches" query Problem it fixes: opening the search page fires Items?...WasSearched=true&SortBy=DateLastSearched before you even type. There is no index on UserDatas.DateLastSearchedInt, and the planner can pick a plan that scans your whole library with expensive per-row visibility subqueries — 100+ seconds of CPU during which everything else on the server queues. This tiny partial index (it only covers the handful of rows where the column is set) makes the plan trivially correct in every case. Apply (safe while Emby runs, ~0.2 s, takes effect immediately): python3 -c " import sqlite3 con = sqlite3.connect('/var/lib/emby/data/library.db', timeout=60) con.execute('PRAGMA busy_timeout=60000') con.execute('CREATE INDEX IF NOT EXISTS idx_custom_UserDatas_LastSearched ON UserDatas(UserId, DateLastSearchedInt) WHERE DateLastSearchedInt IS NOT NULL') con.commit(); con.close(); print('index created')" Revert: python3 -c " import sqlite3 con = sqlite3.connect('/var/lib/emby/data/library.db', timeout=60) con.execute('PRAGMA busy_timeout=60000') con.execute('DROP INDEX IF EXISTS idx_custom_UserDatas_LastSearched') con.commit(); con.close(); print('index dropped')" Verify: open search in Emby Web, then check the request time in the server log — should be milliseconds: grep 'WasSearched=true' /var/lib/emby/logs/embyserver.txt | grep -oE 'Time: [0-9]+ms' | tail -5 Survives restarts, server updates, and VACUUM. Emby doesn't know about it; drop it once an official fix ships. Patch 2 — Full ANALYZE (fix the planner statistics) Problem it fixes: Emby's default DatabaseAnalysisLimit=5000 makes its maintenance run a sampled ANALYZE. On the heavily skewed AncestorIds2 table (folder hierarchy) the sample produces wildly wrong statistics ("1 row per folder" when big folders have tens of thousands), and the planner then picks catastrophic plans for search queries. A full, unlimited ANALYZE records correct statistics. Apply (safe while Emby runs, ~1–2 s, poke included): python3 -c " import sqlite3 con = sqlite3.connect('/var/lib/emby/data/library.db', timeout=60) con.execute('PRAGMA busy_timeout=60000') con.execute('ANALYZE'); con.commit() con.execute('CREATE INDEX IF NOT EXISTS idx_custom_statspoke ON ItemExtradataTypes(Name)'); con.commit() con.execute('DROP INDEX IF EXISTS idx_custom_statspoke'); con.commit() con.close(); print('ANALYZE done + plans refreshed')" Note: running plain ANALYZE also erases Patch 4 if you applied it — the combined recipe at the end reapplies both in one go. Revert (restore the statistics snapshot from Step 0 — only useful for debugging): python3 -c " import sqlite3, glob con = sqlite3.connect('/var/lib/emby/data/library.db', timeout=60) con.execute('PRAGMA busy_timeout=60000') snap = sorted(glob.glob('/root/emby-backups/sqlite_stat1-backup-*.sql'))[-1] con.executescript(open(snap).read()); con.commit() con.execute('CREATE INDEX IF NOT EXISTS idx_custom_statspoke ON ItemExtradataTypes(Name)'); con.commit() con.execute('DROP INDEX IF EXISTS idx_custom_statspoke'); con.commit() con.close(); print('restored', snap)" Patch 3 — system.xml settings Problems these fix: the first two stop Emby's own maintenance from re-creating the bad statistics (undoing Patches 2 and 4 at every shutdown); the pool increase keeps writes (playback progress reporting) flowing when heavy queries are running. Note: a bigger pool alone does NOT stop search convoys — Emby serializes list-type queries internally — which is why Patch 4 matters. In /var/lib/emby/config/system.xml change: <DatabaseAnalysisLimit>0</DatabaseAnalysisLimit> <!-- was 5000 --> <OptimizeDatabaseOnShutdown>false</OptimizeDatabaseOnShutdown> <!-- was true --> <MaxLibraryDatabaseConnections>10</MaxLibraryDatabaseConnections> <!-- was 5; ~your CPU core count is a reasonable value --> Apply (stop → edit → start; ~1 min downtime, streams drop and auto-resume): systemctl stop emby-server nano /var/lib/emby/config/system.xml systemctl start emby-server Revert: same procedure with the original values (see your Step 0 backup of the file; prefer editing values individually over copying the whole file back, in case you changed other settings via the dashboard since). Verify the pool size after start: grep 'SqliteItemRepository: Initializing PooledDatabaseConnectionManager' /var/lib/emby/logs/embyserver.txt | tail -1 Re-check these values after Emby package updates. Patch 4 — Statistics override for AncestorIds2 (the TV-search fix) Problem it fixes: even correct statistics only store the average rows-per-folder (a few), while the top-level library folders used in per-user visibility checks hold thousands to tens of thousands of items. SQLite (without STAT4, which Emby's build lacks) can't see the skew, so inside the per-row visibility subqueries it still drives from the folder side. Every search pays ~1–10 ms per matched item — 1–2-letter searches from TV apps (thousands of matches) take 30–50 s and stall other list queries. This override deliberately overstates the folder-side cost so the planner always probes from the item side instead. The first number in the stat is your table's row count, so it's computed dynamically: Apply (safe while Emby runs, instant, poke included): python3 -c " import sqlite3 con = sqlite3.connect('/var/lib/emby/data/library.db', timeout=60) con.execute('PRAGMA busy_timeout=60000') n = con.execute('SELECT COUNT(*) FROM AncestorIds2').fetchone()[0] con.execute('UPDATE sqlite_stat1 SET stat=? WHERE tbl=? AND idx=?', (f'{n} 3000 1','AncestorIds2','idxAncestorIds2_1')) con.commit() con.execute('CREATE INDEX IF NOT EXISTS idx_custom_statspoke ON ItemExtradataTypes(Name)'); con.commit() con.execute('DROP INDEX IF EXISTS idx_custom_statspoke'); con.commit() con.close(); print(f'override applied: {n} 3000 1')" (3000 approximates the real descendant count of large library folders; the exact value isn't critical — it just needs to be much larger than the item side's few rows.) Revert (a plain full ANALYZE restores honest measured statistics): python3 -c " import sqlite3 con = sqlite3.connect('/var/lib/emby/data/library.db', timeout=60) con.execute('PRAGMA busy_timeout=60000') con.execute('ANALYZE'); con.commit() con.execute('CREATE INDEX IF NOT EXISTS idx_custom_statspoke ON ItemExtradataTypes(Name)'); con.commit() con.execute('DROP INDEX IF EXISTS idx_custom_statspoke'); con.commit() con.close(); print('override removed')" Verify it's in place (second number should be 3000): python3 -c " import sqlite3 con = sqlite3.connect('file:/var/lib/emby/data/library.db?mode=ro', uri=True) print(con.execute(\"SELECT stat FROM sqlite_stat1 WHERE idx='idxAncestorIds2_1'\").fetchone())" If the second number is small (e.g. 1 or 4), the override was erased by something running ANALYZE — see the recovery recipe below. Symptom of loss: short/common-term searches suddenly take 30–50 s again. Results measured on our server after all patches: ST 52 s → 0.08 s, the (29k matches) 27 s → 0.25 s, lord 13 s → 0.008 s, recent-searches 100+ s → a few ms. No regressions in Continue Watching / Next Up / home screens. Recovery recipe: "searches got slow again after an update/restart" Refreshes statistics properly AND reapplies the Patch 4 override, then refreshes plans: python3 -c " import sqlite3 con = sqlite3.connect('/var/lib/emby/data/library.db', timeout=60) con.execute('PRAGMA busy_timeout=60000') con.execute('ANALYZE'); con.commit() n = con.execute('SELECT COUNT(*) FROM AncestorIds2').fetchone()[0] con.execute('UPDATE sqlite_stat1 SET stat=? WHERE tbl=? AND idx=?', (f'{n} 3000 1','AncestorIds2','idxAncestorIds2_1')) con.commit() con.execute('CREATE INDEX IF NOT EXISTS idx_custom_statspoke ON ItemExtradataTypes(Name)'); con.commit() con.execute('DROP INDEX IF EXISTS idx_custom_statspoke'); con.commit() con.close(); print('stats refreshed + override reapplied')" Removing all patches when Emby ships the official fix These are workarounds. When an Emby release notes say the search/statistics issues are fixed, remove the patches in the same maintenance window as that update, so the fixed version runs with a stock schema, stock statistics, and stock config. (For ordinary updates where no fix is mentioned: keep the patches, update normally, and afterwards run the recovery recipe above plus re-check the system.xml values.) 1. While the server is still running (old version), drop the custom index (Patch 1): python3 -c " import sqlite3 con = sqlite3.connect('/var/lib/emby/data/library.db', timeout=60) con.execute('PRAGMA busy_timeout=60000') con.execute('DROP INDEX IF EXISTS idx_custom_UserDatas_LastSearched') con.commit(); con.close(); print('custom index removed')" 2. Stop Emby: systemctl stop emby-server 3. Restore system.xml defaults (Patch 3): set DatabaseAnalysisLimit back to 5000 and OptimizeDatabaseOnShutdown back to true. (MaxLibraryDatabaseConnections is ordinary performance tuning, not part of the bug — keep your higher value or restore 5, your choice.) nano /var/lib/emby/config/system.xml 4. Remove the statistics override (Patches 2/4) by refreshing statistics on the stopped database — no poke needed since every connection will be new on start: python3 -c " import sqlite3 con = sqlite3.connect('/var/lib/emby/data/library.db', timeout=60) con.execute('ANALYZE'); con.commit(); con.close(); print('statistics reset to honest values')" With the defaults restored in step 3, Emby's own maintenance manages statistics again from here on — nothing custom remains in the database or config. 5. Install the update, then start: systemctl start emby-server Verify after the update that search is still fast on the fixed version; if it is not, the patches can be reapplied from the top of this guide at any time. (The Step 0 backups are unrelated to this procedure — they exist only as a safety net in case something goes wrong while patching.)
-

Stumped trying to get an API key to work with Powershell for Movies reporting
FatherSaint replied to FatherSaint's topic in General/Windows
This is ALL Co-Pilot, I don't know what I'm doing when it comes to scripts and programming. That's a good catch, I didn't see it but do now that you ask about it. I just tried that way and still got the error. Unless Tiny Media Manager doesn't give me a proper report, I'm not going to pursue this. Thank you for posting! -
Stumped trying to get an API key to work with Powershell for Movies reporting
Lessaj replied to FatherSaint's topic in General/Windows
Have you tried api_key instead of ApiKey in the URL?- 7 replies
-
- 1
-

-
- powershell
- script
- (and 1 more)
-
4.10.x: SearchTerm queries take 10–30 s when a term has many matches — degenerate sqlite_stat1 makes per-row visibility subqueries scan whole folder subtrees Versions observed: 4.10.0.25 beta (also present on 4.10.0.20/.23). Ubuntu 24.04, .NET 8.0.28, bundled SQLite 3.53.3. Library: ~191,000 MediaItems, ~477,000 AncestorIds2 rows, ~555,000 UserDatas rows. This is a separate issue from my other report about the "recent searches" (WasSearched/DateLastSearched) query freezing the whole server — same server, different query family and different root cause. It is likely the underlying mechanism behind the long-standing "Search Very Slow (3 minute response)" reports (topic 144128), because the cost scales with the number of FTS matches, which is what makes common/multi-word terms pathological. Symptom Typed search time scales with the number of FTS matches, at a huge per-match cost — even though the final result is tiny: SearchTerm FTS matches Server time fellow 18 0.2 s lord of the 44 12.8 s lord 272 12.7–13.7 s (measured repeatedly) the 29,266 ~27 s That is ~50 ms per matched item. Occasionally the identical request completes in 3 ms — pooled connections cache prepared statements, so each connection keeps whatever plan it compiled first ("plan lottery"; see mechanism below). Search fires 2 of these queries per keystroke (/Items + /ItemTypes), so one user typing can occupy multiple pool connections for ~13 s each. Root cause The /Items?SearchTerm=... SQL (recovered verbatim from a process core dump) joins fts_search9 MATCH @SearchTerm to MediaItems — that part is fine and fast. But for every matched row it evaluates a per-row visibility OR-chain (abbreviated): ... AND ( EXISTS (SELECT 1 FROM AncestorIds2 WHERE itemid=A.Id AND AncestorId IN (<15 allowed folder ids>)) OR EXISTS (SELECT 1 FROM ListItems JOIN ancestorids2 ON ListItems.ListItemId=ancestorids2.itemid AND ancestorids2.AncestorId IN (<15 ids>) WHERE ListItems.ListId=A.Id) OR EXISTS (SELECT 1 FROM itemPeople2 JOIN AncestorIds2 ... WHERE itemPeople2.PersonId=A.Id ...) OR EXISTS (SELECT 1 FROM ItemLinks2 JOIN ancestorids2 ... WHERE ItemLinks2.LinkedId=A.Id ...) OR EXISTS (... ItemLinks2 two-level variant ...) ) On this system sqlite_stat1 contained degenerate statistics: AncestorIds2 | idxAncestorIds2_1 | 470105 1 1 <-- claims 1 row per AncestorId Reality: 476,645 rows, 146,460 distinct AncestorIds, and an extremely skewed distribution — the top folder has 89,352 descendant rows, and the 15 folder ids in the IN-list cover ~85,000+ rows. Believing "1 row per AncestorId", the planner drives those inner EXISTS joins from ancestorids2 (AncestorId=?) — i.e. it enumerates entire folder subtrees once per matched item (EXPLAIN QUERY PLAN showed SEARCH ancestorids2 USING COVERING INDEX idxAncestorIds2_1 (AncestorId=?) as the outer side of the ListItems/ItemLinks2/ItemPeople2 subqueries). ~55 ms per row × hundreds of matches = 10–30 s per keystroke. The degenerate stats look like the output of an approximate ANALYZE (PRAGMA optimize with an analysis_limit) sampling a heavily skewed index — the totals (470105 vs current 476645) show they were produced recently on this very database, and a limited sample of AncestorIds2 easily lands in the mostly-unique region and concludes "1 row per key". If the server re-runs limited analysis periodically, good stats get regressively overwritten. Fix verified on this server A full, unlimited ANALYZE corrected the estimates (avg 4 rows/AncestorId), which flips the inner join order to the item-side (ListItems (ListId=A.Id), itemPeople2 (PersonId=A.Id), ...): lord: 13 s → ~1.0 s end-to-end lord of the: 12.8 s → ~1.0 s No regressions measured in the NextUp/Resume or other query families. Important operational detail: ANALYZE does not change the schema cookie, so pooled connections holding cached prepared statements never re-plan and keep the old behavior indefinitely. The running server only picked up the new stats after we forced a schema-cookie bump (create+drop of a dummy index). If Emby runs ANALYZE as maintenance, it should invalidate/re-prepare its cached statements afterwards, or the fix silently doesn't apply until restart. Remaining structural cost (even with correct stats) SearchTerm=the (29,266 matches) still takes ~27 s at ~1.1 ms/row, because: The query computes count(*) OVER() AS TotalRecordCount even though the client sends EnableTotalRecordCount=false — forcing full enumeration of all matches before LIMIT 50 can apply. Each row evaluates a ShareLevel scalar subquery containing ORDER BY Distance LIMIT 1 — a temp-sort per row — plus the visibility EXISTS chain. This expensive per-row form is used for users that have UserItemShares rows; the variant generated for folder-restricted users instead materializes the allowed-items set once as a CTE (WITH WithAncestors AS (...) ... A.Id IN WithAncestors) and measures ~5× cheaper per row. Suggested fixes: Honor EnableTotalRecordCount=false (skip the window count). Use the materialized-CTE visibility form for all user types instead of per-row EXISTS chains. Ship correct/full statistics (or add explicit indexes/query shapes that don't depend on stat1 being right), and re-prepare cached statements after any ANALYZE. Where the degenerate stats come from (confirmed) — and why TV clients hit this hardest Found the mechanism in the server's own configuration defaults: system.xml on this install has <DatabaseAnalysisLimit>5000</DatabaseAnalysisLimit> together with <OptimizeDatabaseOnShutdown>true</OptimizeDatabaseOnShutdown>. Every shutdown therefore runs a limited ANALYZE (analysis_limit=5000) over indexes like AncestorIds2 whose leading column is massively skewed — a 5000-row sample lands in the mostly-unique region and records "1 row per key". So even after a manual full ANALYZE fixes the stats, the next shutdown re-poisons them. Suggested fix: use analysis_limit=0 (full) for these indexes, ship static correct stats, or don't let optimize overwrite better stats. TV clients make the per-match cost catastrophic in practice: they search per keystroke starting from the first letter. Captured live (Tizen TV app, same behavior on LG): typing "STI…" fired SearchTerm=S (96,295 FTS matches on this library), then SearchTerm=ST (9,118 matches) — the ST pair of queries (/Items + /ItemTypes) each ran 52 s, and with the default MaxLibraryDatabaseConnections=5 the whole server convoyed behind them (playback progress POSTs queued up to 34 s; other users' home screens 30–40 s). One person typing on a TV remote = server-wide outage of ~1 minute, even with corrected stats, because of the O(matches) enumeration described above. Workaround verified on this server (admin-level, at your own risk) Because sqlite_stat1 only stores per-index averages (this build has no STAT4), even a correct full ANALYZE (avg 4 rows/AncestorId) cannot express that the specific folder ids used in visibility clauses are the skewed giants — so the planner keeps choosing folder-side scans inside the per-row EXISTS subqueries. Overriding the average for the AncestorId-leading index with a deliberately pessimistic value flips every visibility subquery to the cheap item-side probes: UPDATE sqlite_stat1 SET stat='476645 3000 1' WHERE tbl='AncestorIds2' AND idx='idxAncestorIds2_1'; -- then force cached statements to re-plan (ANALYZE/stat changes don't bump the -- schema cookie): create+drop any dummy index, or restart the server. Measured results on the live server (191k-item library, ~30 concurrent users): SearchTerm before after ST (2 letters, 9,118 matches) 52 s 0.08 s the (29,266 matches) 27 s 0.25 s lord (272 matches) 13 s 0.008 s No regressions observed in NextUp/Resume/home-screen query families. Note OptimizeDatabaseOnShutdown/limited ANALYZE will overwrite this row, so the override must be reapplied after any stats maintenance (we disabled OptimizeDatabaseOnShutdown). This is presented as evidence of the root cause and a stopgap — the proper fix belongs in the query/schema (see suggestions above). Reproduction guidance Large library (100k+ items) with a deep folder hierarchy (skewed AncestorIds2), a user with UserItemShares rows and a folder allow-list, and degenerate stat1 (run a limited/approximate ANALYZE to get there, or inject '470105 1 1'-style rows). Then search a term with a few hundred matches and compare against a term with <20 matches: the time difference is entirely the per-row visibility evaluation. No SQLite errors are logged at any point; the database passes PRAGMA quick_check; this is purely query-plan behavior.